

Data Science Roadmap for Beginners: Complete Step-by-Step Guide (2026)
Introduction
If you are interested in breaking into Data Science, you have probably asked yourself: “Where do I actually start?”
The main challenge today is not a lack of resources—thousands of tutorials, bootcamps, documentation pages, and videos exist online. The real obstacle is knowing what to learn, in what order, and how each skill connects to real-world business impact.
Many beginners jump straight into complex Deep Learning or Generative AI algorithms before mastering core prerequisites. Without strong foundations in data handling, statistics, and querying, they quickly hit roadblocks and feel overwhelmed.
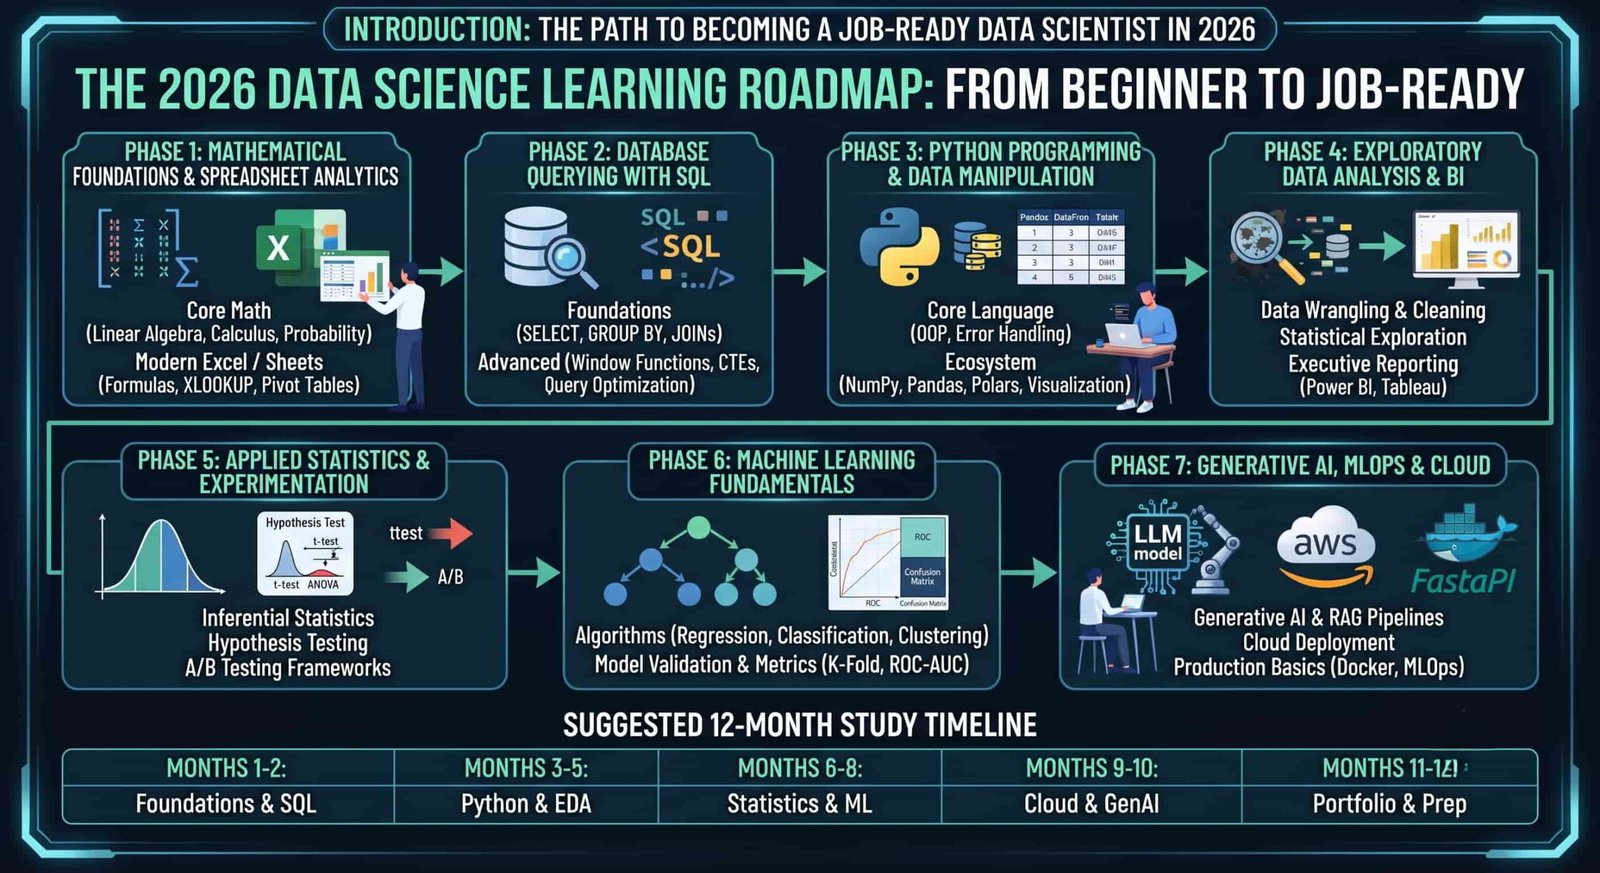
Data Science follows a clear, progressive learning trajectory. This comprehensive 2026 roadmap outlines the exact tools, methodologies, and milestones needed to move from a complete beginner to a job-ready data professional.
What Does a Modern Data Scientist Do?
Before writing code, it is essential to understand the core responsibilities of the role. A Data Scientist acts as a bridge between raw data, statistical modeling, and business execution.
       ┌────────────────────────────────────────────────────────┐
       │                 Modern Data Scientist                  │
       └───────────────────────────┬────────────────────────────┘
                                   │
      ┌────────────────────────────┼────────────────────────────┐
      ▼                            ▼                            ▼
┌───────────────┐          ┌───────────────┐          ┌───────────────────┐
│   Analytics   │          │  Engineering  │          │  Decision Science │
│  • EDA        │          │  • Pipelines  │          │  • ROI Insights   │
│  • Statistics │          │  • ML Models  │          │  • Executive KPIs │
│  • Dashboards │          │  • Production │          │  • Storytelling   │
└───────────────┘          └───────────────┘          └───────────────────┘
Modern data professionals focus on four key outcomes:
-
Explaining past trends: Identifying root causes behind business performance shifts.
-
Forecasting outcomes: Training predictive models to estimate demand, churn, or risk.
-
Building automated systems: Deploying recommendation engines, fraud detectors, and AI assistants.
-
Guiding strategy: Translating complex technical findings into actionable executive roadmaps.
The 2026 Data Science Learning Roadmap
Phase 1: Mathematical Foundations & Spreadsheet Analytics
Before touching advanced programming, build quantitative reasoning and baseline data intuition.
-
Core Math & Probability: Master linear algebra essentials (matrices, vectors), calculus basics (gradients), and core probability (distributions, conditional probability, Bayes’ Theorem).
-
Modern Excel / Sheets: Formulas, XLOOKUP, Pivot Tables, conditional formatting, and exploratory charts. Spreadsheets remain the quickest tool for building initial intuition about tabular data.
Phase 2: Database Querying with SQL
Data rarely comes packaged in clean CSV files; it lives in production relational databases and warehouses.
-
Foundations:
SELECT,WHERE,ORDER BY,GROUP BY,HAVING, and aggregation functions. -
Intermediate:
INNER/LEFT/RIGHT/FULL JOINS,CASEstatements, Subqueries, and Union operations. -
Advanced: Window Functions (
ROW_NUMBER(),RANK(),LEAD(),LAG()), Common Table Expressions (CTEs), indexing strategies, and query plan optimization.
Phase 3: Python Programming & Data Manipulation
Python remains the primary programming language of the global data ecosystem.
┌─────────────────────────────────────────────────────────┐
│                  Python Data Ecosystem                  │
├───────────────┬───────────────┬─────────────────────────┤
│ Computation   │ Manipulation  │ Visualization           │
│ • NumPy       │ • Pandas      │ • Matplotlib            │
│ • SciPy       │ • Polars      │ • Seaborn               │
└───────────────┴───────────────┴─────────────────────────┘
-
Core Language Concepts: Data structures (lists, dictionaries, sets), control flow, list comprehensions, error handling, and Object-Oriented Programming (OOP).
-
Vectorized Data Processing: NumPy for numerical arrays and matrix operations.
-
Tabular Manipulation: Pandas and Polars for filtering, merging, pivoting, string parsing, and handling datetime objects.
Phase 4: Exploratory Data Analysis & Business Intelligence
Raw data must be validated, cleaned, and communicated visually to stakeholders.
-
Data Wrangling: Imputing missing values, removing duplicates, and managing outliers.
-
Statistical Exploration: Detecting correlations, evaluating skewness, and running sanity checks.
-
BI Dashboards: Build interactive, drill-down executive reporting using Power BI, Tableau, or open-source solutions like Streamlit and Looker Studio.
Phase 5: Applied Statistics & Experimentation
Machine learning models are only as good as the statistical assumptions behind them.
-
Inferential Statistics: Central Limit Theorem, confidence intervals, standard errors, and p-values.
-
Hypothesis Testing: Two-sample t-tests, ANOVA, Chi-Square tests.
-
A/B Testing Frameworks: Sample sizing, minimum detectable effect (MDE), conversion metrics, and guarding against false positives.
Phase 6: Machine Learning Fundamentals
Move from descriptive analytics to predictive modeling using battle-tested algorithms.
| Learning Paradigm | Primary Algorithms | Common Business Use Cases |
| Supervised (Regression) | Linear/Ridge/Lasso Regression, Random Forest, XGBoost | Revenue projection, dynamic pricing, real estate valuation |
| Supervised (Classification) | Logistic Regression, Decision Trees, LightGBM | Customer churn, credit risk, spam and fraud classification |
| Unsupervised Learning | K-Means, Hierarchical Clustering, PCA | Customer segmentation, anomaly detection, dimension reduction |
-
Validation & Metrics: Master training/validation splits, K-Fold cross-validation, Confusion Matrices, ROC-AUC curves, Precision-Recall tradeoffs, and RMSE/MAE evaluation.
Phase 7: Generative AI, MLOps & Cloud Computing
In 2026, data science workflows increasingly integrate with Large Language Models (LLMs) and cloud-native infrastructure.
-
Generative AI & Agentic Systems: Working with modern LLM APIs, building Retrieval-Augmented Generation (RAG) pipelines using vector databases (Pinecone, Chroma, Qdrant), and prompt orchestration via LangChain or LlamaIndex.
-
Cloud Platforms: Deploying solutions and managing datasets on AWS (S3, SageMaker), GCP (BigQuery, Vertex AI), or Microsoft Azure.
-
Production Basics (MLOps): Containerizing environments using Docker, building lightweight inference microservices with FastAPI, and tracking experiments via MLflow or Weights & Biases.
Suggested 12-Month Study Timeline
| Month | Phase Focus | Key Deliverable / Milestone |
| 1 | Math & Excel Analytics | Interactive Excel Financial / Sales Dashboard |
| 2 | SQL Database Querying | Complex multi-table business case analysis on PostgreSQL |
| 3–4 | Python & Data Wrangling | Automated data extraction and EDA pipeline with Pandas |
| 5 | Data Visualization & BI | Executive-ready Power BI / Tableau operational dashboard |
| 6 | Applied Statistics & A/B Tests | Comprehensive statistical experimentation report |
| 7–8 | Classical Machine Learning | End-to-end churn prediction model with Scikit-Learn and XGBoost |
| 9–10 | Cloud, GenAI & MLOps | RAG-powered data assistant deployed via FastAPI and Docker |
| 11–12 | Portfolio & Interview Prep | Polished GitHub repositories, case studies, and mock technical interviews |
Common Beginner Traps to Avoid
-
Tutorial Hell: Watching endless videos without writing code from scratch on dirty, real-world datasets.
-
Skipping SQL and Data Prep: Jumping straight into neural networks while neglecting the data extraction and cleaning steps that take up 70% of real-world jobs.
-
Ignoring Model Evaluation Nuances: Relying solely on raw accuracy when dealing with heavily imbalanced datasets (e.g., fraud or rare disease detection).
-
Focusing on Complexity Over Value: Choosing an over-engineered deep learning model when a simple, interpretable logistic regression or decision tree solves the business problem.
How to Build a Standout Portfolio
Certificates indicate course completion; portfolio projects prove operational capability.
Portfolio Structure Checklist:
requirements.txtorDockerfile.
Conclusion
Data Science is not a single isolated skill—it is a disciplined synthesis of programming, mathematical foundations, data engineering, and business translation.
By following a structured path—mastering SQL, Python, and statistical fundamentals before layering on Machine Learning, Cloud services, and modern AI architectures—you build sustainable, job-ready expertise capable of solving real-world challenges.
Frequently Asked Questions
Check Other POst Here:
1. https://risewithvishwas.com/articles_post/data-science-lifecycle/
2. https://risewithvishwas.com/articles_post/how-data-science-works/
3. https://risewithvishwas.com/articles_post/data-science-definition-and-examples/
4. https://risewithvishwas.com/articles_post/what-is-data-science/