

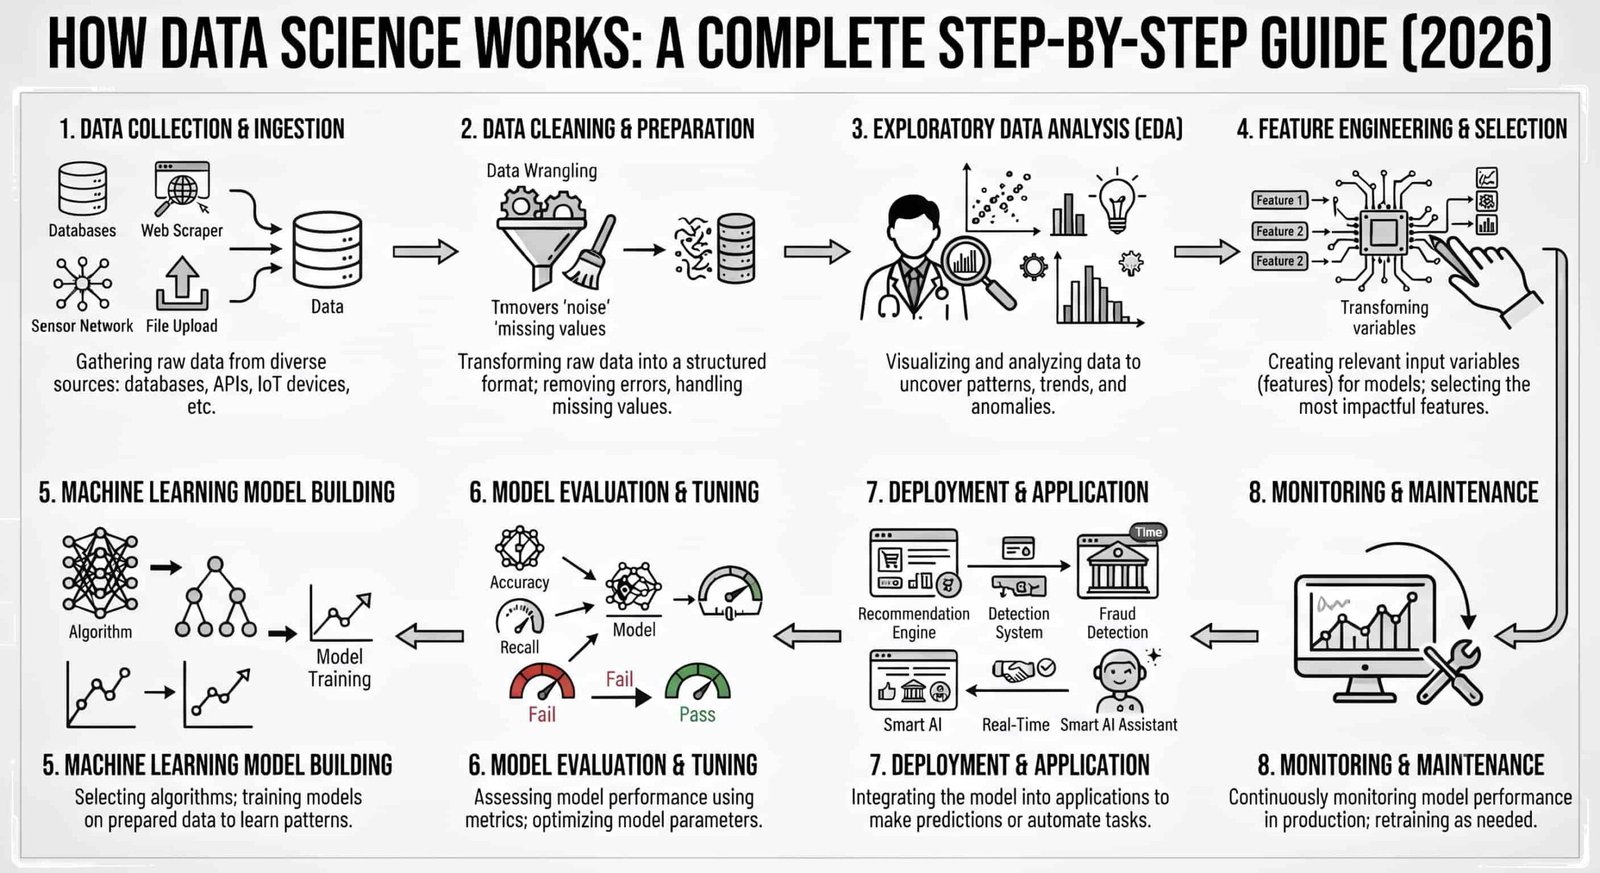
How Data Science Works: A Complete Step-by-Step Guide (2026)
Introduction
Many people know that Data Science involves working with data, but fewer understand what actually happens behind the scenes. How does raw, unstructured information transform into strategic business insights? How do modern companies predict customer churn, flag financial fraud in milliseconds, or serve personalized recommendations?
The answer lies in the Data Science process.
Data Science follows a structured, iterative workflow designed to convert noise into intelligence. Mastering this sequence is foundational for anyone aiming to become a Data Scientist, Data Analyst, Machine Learning Engineer, or AI specialist.
In this guide: A complete, step-by-step breakdown of how a modern data science project moves from an abstract business question to a high-performing production deployment.
The End-to-End Data Science Workflow
A robust Data Science workflow consists of 10 structured steps:
| Step | Phase | Core Objective | Key Deliverable |
| 1 | Problem Definition | Translate business challenges into measurable goals | Project scope & success metrics |
| 2 | Data Collection | Gather relevant internal and external data | Raw data pipeline |
| 3 | Data Cleaning | Eliminate errors, duplicates, and missing values | Clean, standardized dataset |
| 4 | Exploratory Data Analysis | Identify distributions, correlations, and anomalies | Initial insights & hypothesis tests |
| 5 | Feature Engineering | Transform raw fields into predictive input variables | Model-ready feature matrix |
| 6 | Model Building | Select and train appropriate algorithms | Trained candidate models |
| 7 | Model Evaluation | Validate accuracy, precision, and error rates | Performance scorecard |
| 8 | Data Visualization | Translate results for business stakeholders | Dashboards & executive reports |
| 9 | Deployment | Integrate the model into production software | Live API endpoint or batch pipeline |
| 10 | Monitoring & Maintenance | Track performance degradation and data drift | Retraining schedule & alerts |
Step 1: Define the Problem
Every successful project begins with a clear business question. Without a well-scoped problem statement, even state-of-the-art algorithms will fail to deliver value.
Data scientists collaborate with stakeholders to define:
-
Business Objective: What specific metric needs improvement (e.g., reducing customer churn by 5%)?
-
Success Criteria: Which KPI determines project success (e.g., precision vs. recall)?
-
Resource Constraints: What are the compute limits, latency requirements, and budget boundaries?
Step 2: Collect the Data
Once the objective is established, data is gathered from multiple sources to create a complete operational picture:
-
Internal Databases & Warehouses: SQL databases, Snowflake, BigQuery.
-
APIs & Web Services: Third-party financial data, social sentiment streams, weather feeds.
-
Telemetry & Event Logs: Clickstream data, mobile application logs, user sessions.
-
Sensors & Edge Devices: IoT telemetry, manufacturing line sensors, GPS trackers.
Step 3: Clean the Data
Raw data is almost never immediately usable. Data cleaning typically consumes 60% to 80% of a data team’s time.
Common Cleaning Challenges & Solutions
-
Missing Values: Impute using statistical metrics (mean, median, mode) or flag as a distinct category.
-
Duplicate Entries: Identify and deduplicate multi-channel records.
-
Type Inconsistencies: Convert mixed strings (e.g.,
"twenty-seven"to27) into standardized numeric types. -
Outliers: Filter out invalid sensor glitches or erroneous manual inputs.
Step 4: Exploratory Data Analysis (EDA)
Before training models, analysts examine the dataset’s structural characteristics using statistical methods and preliminary charts:
-
Compute central tendencies, variance, and skewness.
-
Plot correlation heatmaps to see which variables influence the target metric.
-
Identify hidden trends, demographic patterns, and unexpected distributions.
Step 5: Feature Engineering
Feature engineering involves creating informative variables that help algorithms learn underlying patterns more effectively:
-
Raw Field:
Date of Birth$\rightarrow$ Engineered Feature:AgeandAge Bracket -
Raw Field:
Timestamp Logs$\rightarrow$ Engineered Feature:Time Since Last PurchaseandIs_Weekend -
Raw Field:
Transaction Value$\rightarrow$ Engineered Feature:Ratio of Transaction to 30-Day Average Spend
Key Rule: Better features beat more complex algorithms. Thoughtful feature engineering is often what separates an average model from a production-ready solution.
Step 6: Build Machine Learning Models
Data scientists split the prepared data into training and testing sets, then select suitable algorithms based on the problem type:
-
Regression: Predicts continuous quantities (e.g., sales volume, house prices).
-
Classification: Categorizes records into discrete classes (e.g., fraud vs. legitimate, customer churn vs. retention).
-
Clustering: Groups unlabelled data points by similarity (e.g., audience segmentation).
-
Recommendation Engines: Powers collaborative and content-based recommendation feeds.
Step 7: Evaluate Model Performance
Models must be tested against unseen holdout data using task-appropriate evaluation metrics:
-
Classification Metrics:
-
Precision: How many of our positive predictions were actually correct?
-
Recall: How many actual positive cases did the model capture?
-
F1-Score: The harmonic mean of precision and recall.
-
-
Regression Metrics:
-
RMSE / MAE: Root Mean Squared Error / Mean Absolute Error to quantify prediction variance.
-
Step 8: Visualize Insights
Technical performance must be translated into actionable business strategy. Using tools like Tableau, Power BI, or Seaborn, teams create visual assets:
-
Interactive executive dashboards.
-
Risk distribution heatmaps.
-
Trend charts linking model predictions directly to ROI and cost savings.
Step 9: Deploy the Solution
A model only generates business value once integrated into live systems. Deployment options include:
-
REST APIs (FastAPI, Flask): Serving real-time inference on web and mobile apps.
-
Batch Pipelines: Running nightly or weekly predictions (e.g., inventory forecasting).
-
Embedded / Edge Deployments: Running lightweight models directly on mobile devices or IoT hardware.
Step 10: Monitor and Improve
Deployed models degrade over time as customer behavior shifts and market dynamics evolve (known as data drift or concept drift).
Continuous monitoring ensures:
-
Prediction latency stays within service-level agreements (SLAs).
-
Data drift alerts trigger automated model retraining.
-
Edge cases and false positives are logged for continuous quality checks.
Real-World Workflow Example: E-Commerce Demand Forecasting
[1. Goal: Forecast Q4 SKU Demand]
               │
               ▼
[2. Ingest: Sales History, Web Traffic, Promotions]
               │
               ▼
[3. Clean: Standardize Units, Fix Missing Values]
               │
               ▼
[4. EDA: Detect Holiday Spikes & Regional Trends]
               │
               ▼
[5. Engineer: Rolling 7-Day Averages & Discount Flags]
               │
               ▼
[6. Train: XGBoost & LightGBM Regressors]
               │
               ▼
[7. Evaluate: Minimize RMSE on Validation Sets]
               │
               ▼
[8. Report: Supply Chain Visual Dashboards]
               │
               ▼
[9. Deploy: Daily Batch Predictions to ERP]
               │
               ▼
[10. Monitor: Track Forecast Drift vs. Realized Sales]
Essential Modern Tooling (2026)
-
Data Extraction & Storage: SQL, Apache Spark, Snowflake, BigQuery
-
Data Prep & Analysis: Python, Pandas, NumPy, Polars
-
Visualization: Tableau, Power BI, Streamlit, Matplotlib
-
Modeling & ML: Scikit-Learn, XGBoost, PyTorch, TensorFlow
-
Production & MLOps: Docker, FastAPI, MLflow, AWS SageMaker, GCP Vertex AI
Conclusion
The power of Data Science comes from a disciplined, repeatable process rather than isolated algorithmic tricks. By moving systematically from problem definition through data prep, model evaluation, and live deployment, organizations can consistently turn complex data into competitive advantages.
Mastering this end-to-end lifecycle ensures your analytics solutions deliver accurate, trustworthy, and measurable real-world impact.
Check out posts here:
1. https://risewithvishwas.com/articles_post/what-is-data-science/
2. https://risewithvishwas.com/articles_post/data-science-definition-and-examples/